
Published 2026-07-01
Keywords
- Active Methodology,
- Analytical Chemistry,
- Coffee,
- Contextualization,
- Instrumental Analysis
Copyright (c) 2026 Orbital: The Electronic Journal of Chemistry

This work is licensed under a Creative Commons Attribution-NonCommercial-NoDerivatives 4.0 International License.
How to Cite



Abstract
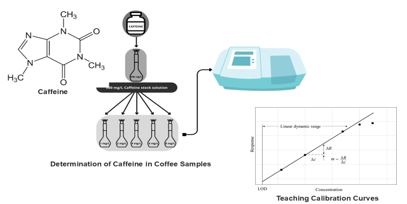
Analytical Chemistry involves the identification and quantification of chemical substances through the application of precise measurement techniques, quantitative reasoning, and analytical instrumentation. This study presents a clear and practical approach to introducing key quantitative concepts in Analytical Chemistry using UV–Vis spectrophotometry to determine caffeine in coffee. The method employs calibration curves to illustrate how instrumental signals can be related to analyte concentration, connecting fundamental analytical concepts to a real analytical problem. The proposed procedure involves liquid–liquid extraction of caffeine followed by UV–Vis measurements at its absorption maximum, and the construction of a calibration model in the range of 1–8 mg L⁻¹ using duplicate measurements. The regression equation obtained was y = 0.0742x − 0.0016, with R² = 0.9987, indicating linear behavior in this range. Based on this model, the method presented a limit of detection (LOD) of 0.15 mg L⁻¹ and a limit of quantification (LOQ) of 0.50 mg L⁻¹. When applied to commercial coffee samples, the analytical curve indicated caffeine concentrations ranging from 0.56 to 0.74% (w/w). These results allowed discussion of variability in caffeine content among the samples analyzed, as well as the comparison of the obtained values with current regulatory standards. This article corresponds to Part II of a teaching-oriented series in Analytical Chemistry. While Part I addressed method validation (precision and accuracy) through sodium determination in dietary supplements, the present work focuses on calibration, regression analysis, residual evaluation, and quantitative interpretation using a real food matrix.